Vega-Lite Charts
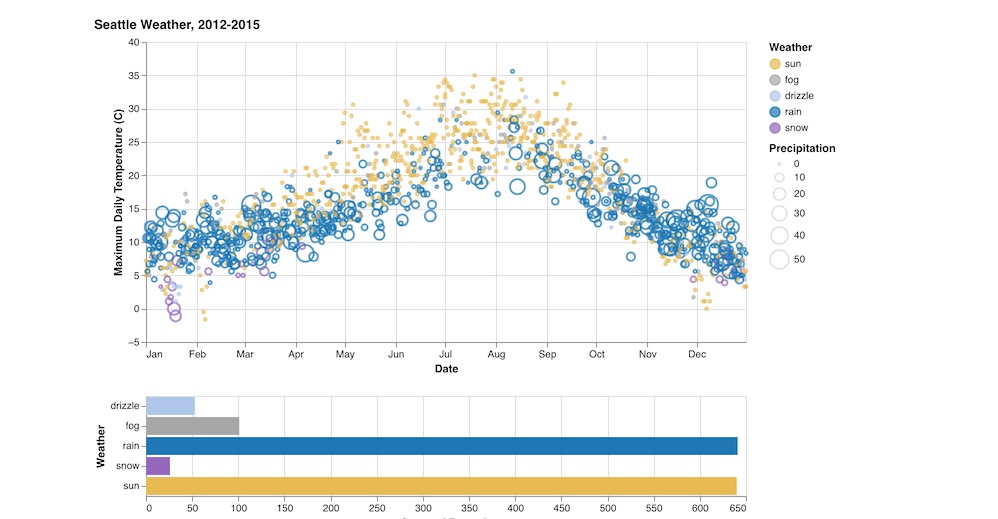 Scatterplot and horizontal box plot
Vega-Lite is an interactive charting library that uses a well-known declarative syntax for defining charts known as "Grammar of Graphics".
See the Vega-Lite website for many examples of typical data visualizations that are possible: the usual bar-charts, scatterplots, and much more are possible.
Usage
A file named *.vega.json must be present in working folder. Each json file matching that pattern will produce a separate Vega-Lite diagram.
DATA can either be an array of hard-coded values (see example.vega.json) or a URL pointing to a file containing an array of JSON or CSV data as in movies.vega.json. The file format is guessed based on the file extension.
See Data in Vega for the full story on what data types are supported by Vega.
- If the URL is pointing to a file in the local filestorage, the plugin will load it directly and embed the data in the object automatically.
- If the URL is a fully-qualified URL, the Vega library will load it on its own.
AUTOSIZE must be set as in the example below for the charts to be responsive to window size changes.
WIDTH and HEIGHT can be hardcoded to pixel sizes, but a width set to container will be responsive. Height needs to be specified.
example.vega.json
{
  "$schema": "https://vega.github.io/schema/vega-lite/v4.json",
  "data": { "url": "movies.json" },
  "transform": [
    {
      "filter": {
        "and": [
          { "field": "IMDB Rating", "valid": true },
          { "field": "Rotten Tomatoes Rating", "valid": true }
        ]
      }
    }
  ],
  "mark": "rect",
  "width": "container",
  "height": 300,
  "autosize": { "type": "fit", "resize": true },
  "encoding": {
    "x": {
      "bin": { "maxbins": 60 },
      "field": "IMDB Rating",
      "type": "quantitative"
    },
    "y": {
      "bin": { "maxbins": 40 },
      "field": "Rotten Tomatoes Rating",
      "type": "quantitative"
    },
    "color": {
      "aggregate": "count",
      "type": "quantitative"
    }
  },
  "config": {
    "view": {
      "stroke": "transparent"
    }
  }
}