Introduction
aftersim is a unique, web-based data visualization tool for researchers building disaggregate, agent-based transportation simulations with MATSim.
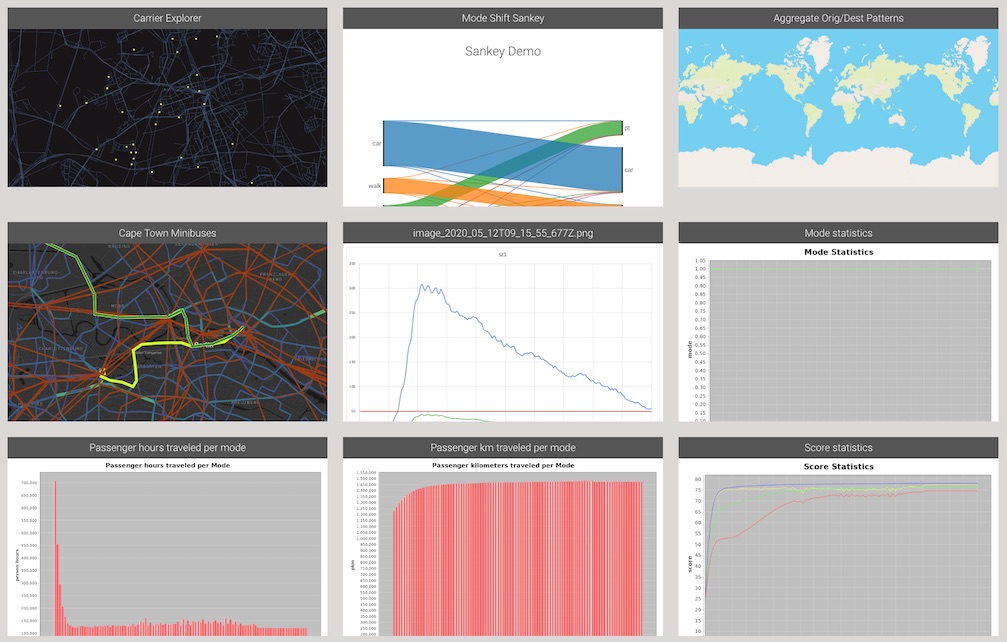
aftersim provides many interactive views such as agent movements through time, aggregate link and area volumes, scenario comparison, and a lot more.
The open-source code and plugin architecture of aftersim allows you to fork the project and create your own visualizations, too.
This guide assumes you are either using the main aftersim site, or have already set up your own instance of aftersim and have access to the file storage area that you configured.
1. Where to store your files
aftersim is essentially a very fancy file browser that works on the web. It allows you to browse the files and subfolders in the file storage areas you configure:
- for VSP, everything in our public subversion server is available.
- You can also view files on your local computer by running a tiny file server locally!
- If you have mounted remote cluster file systems on your machine, then you can see those, too.
For each folder, aftersim depicts zoomable thumbnails of all of the standard MATSim summary charts (iteration statistics, mode shares, etc). It will also show thumbnails for every visualization that you have set up for that folder (See #2 below). Clicking on any thumbnail will bring up a full screen visualization.
Viewing files stored on public-svn and other internet locations
The main aftersim site can be used to view local files on your computer and all project folders on the VSP public-svn server. If you have write access to public-svn, you can create your own project folders there for your simulations, too.
To set up aftersim for other storage locations, you need to fork aftersim and set up your own instance, pointing to a storage location somewhere. This is what we did for the AVÖV project, for example. Billy can probably help you get this set up.
Viewing local folders on your computer
You can access files on your local computer by running a small file server app on "localhost:8000". You can set any folder on your computer as the root folder, and then aftersim will have access to anything in that folder including subfolders below it. Only you will have access to these files: they are not network- or internet-accessible.
- See File Management for instructions on setting up a local file server.
Viewing files on the TU math cluster or other remote machines
You can "virtually" mount remote filesystems using the tool sshfs. It creates an ssh tunnel to the remote machine using your username/login credentials, and mounts the files it finds there under a subfolder on your machine.
Once the sshfs tunnel is established, you can browse the files there as if the files are local on your machine, as above.
2. Visualizations and their YAML files
Most MATSim outputs such as the *.xml.gz files are too large to open in a web browser, so there is also a set of visualization plugins which can display something useful for you. Plugins exist for lots of things and the list is growing: link volumes, agent animations, aggregate area summaries, and more.
Here's how it works: For every visualization you want to create, you write a small configuration file and store it in the same folder as the inputs for that visualization. (We use the YAML text format, which is a common configuration file format.) For each properly named YAML file, one visualization thumbnail will appear in that folder when you navigate to the folder in aftersim. Clicking on the thumbnail will open that visualization full-screen.
Generally, a viz will require a specific set of inputs, and those inputs are usually the result of some post-processing of the raw MATSim outputs. It's up to you to do that post-processing and commit the files to public-svn in the same folder as your config file.
3. Creating visualizations for your model outputs
Here is an example YAML config file for a link-volume summary:
viz-links-example.yaml:
title: "Taxi Passengers"
description: "Hourly passenger pickups"
csvFile: "vol_passengers.csv"
geojsonFile: "../road-network.json.gz"
projection: "EPSG:25832"
sampleRate: 0.10
This config names two files, a CSV of link volumes and a zipped JSON file of the MATSim road network, and some parameters needed for the viz to work. Those files are outputs of some post-processing scripts described in the plugin docs.
If you wanted to look at several different link volume plots from the same model run, (e.g. for vehicle counts instead of passengers), you would make a copy of this file, give it a different name, and edit the csvFile parameter to point to the correct CSV.
This is a very different paradigm than most "point and click" GIS tools, but we have found that the ability to script and cut/paste the config files has been a huge time saver and also reduces manual errors.
Make sure that your files are allowed to be "world-readable" before you publish anything to public-svn! Once files are pushed to public-svn, they are not secured in any way; anyone on the internet can access them!
Plugins
Each visualization is described in the "Plugins" section of this documentation, including how to post-process the outputs and how to define any configuration settings.
If you want to modify or create your own plugins, check out the plugin guide.
Thank you!
I'm glad you're here! Good luck with aftersim and thank you for the feedback and contributions. -- Billy