Link Volumes
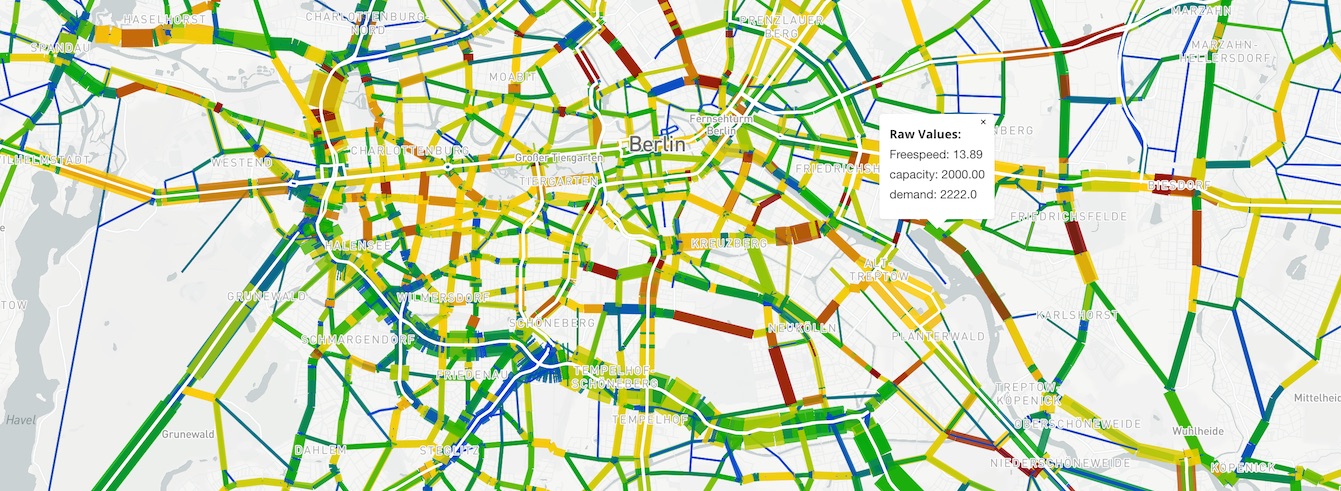 Bandwidth plot
Link bandwidth plot plugin. Supports regular bandwidth plots as well as difference and sum plots when comparing two alternatives.
Usage
A file named viz-links-*.yml must be present in working folder. Each yml file matching that pattern will produce a separate link volume diagram.
viz-links-example.yml
title: "Passagieraufkommen in Sammeltaxis"
description: "Stündliches Passagieraufkommen in Sammeltaxis"
csvFile: "../base/hourlyTrafficVolume_passengers_VEHICLEFILTER-drt-vehicles.csv"
csvFile2: "Vu-DRT-1.link_hourlyTrafficVolume_passengers_VEHICLEFILTER-drt-vehicles.csv"
geojsonFile: ../vulkaneifel-network.geo.json.gz
shpFile: "vulkaneifel-network/vulkaneifel-network.shp"
dbfFile: "vulkaneifel-network/vulkaneifel-network.dbf"
projection: "EPSG:25832"
widthFactor: 0.01
sampleRate: 0.25
thumbnail: thumbnail-roads.jpg
shpFileIdProperty: "ID"
YAML fields explained
geojsonFile: geojson-converted network file. Use the python script in scripts/create-network.py to create a geojson network from a matsim network.xml.gz file.
- Command is
python3 create-network.py [mynetwork.xml.gz] - and will create a file with the name
mynetwork.json.gz.
shpFile,dbfFile: (deprecated) filenames for the alternative, slower network file in shapefile format. Don't use this if you have created the geojson network file above.
csvFile: dataset, or "base" dataset for difference plots
csvFile2: (optional) "project" dataset for difference plots
sampleRate: MATSim simulation sample rate; i.e. a 1% sample should use 0.01 here so that volumes are scaled properly
shpFileIdProperty: property name of field in Shapefile which contains area ID for linking shapefile regions to csvFile data.
Note: All filename fields can refer to parent folders using ../.
- example:
geojsonfile: '../networks/base.json.gz'
This works as far up the hierarchy as the base of the public-svn specified in svnConfig.js but no further.
Required model output post-processing
geoJsonFile - The standard MATSim network.xml.gz file is very inefficient and slow to load. Create the geoJsonFile network file using the following Python script:
- create-network.py
- You will need to install Python 3 to use this script.
csvFile - Use whatever method you like to produce a CSV for your data. The first line of the file should contain labels of the column names, e.g. the hour of the day, etc.
- First column must include the link ID, identical to the link ID in the network file
- All remaining columns will be available and will be labeled accordingly. The viz will also produce a sum "total" automatically
example-data.csv
link;01:00:00;02:00:00;03:00:00;04:00:00;05:00:00;06:00:00;07:00:00;08:00:00;09:00:00;10:00:00;11:00:00;12:00:00;13:00:00;14:00:00;15:00:00;16:00:00;17:00:00;18:00:00;19:00:00;20:00:00;21:00:00;22:00:00;23:00:00;24:00:00;25:00:00;26:00:00;27:00:00;28:00:00;30:00:00
72539930;0;0;0;0;7;13;20;16;13;15;18;17;32;25;29;55;53;43;48;12;12;10;4;4;4;0;0;0;0
42868713;0;0;0;0;0;0;0;0;0;0;0;0;0;1;0;0;1;1;0;0;0;0;0;0;0;0;0;0;0
72539936;0;1;0;0;17;57;63;52;51;47;49;59;78;67;73;113;99;98;107;47;38;36;24;13;4;0;0;0;0
6173553;0;1;0;3;5;1;10;10;9;3;8;4;6;3;4;9;5;7;4;2;1;1;1;2;0;1;0;0;0